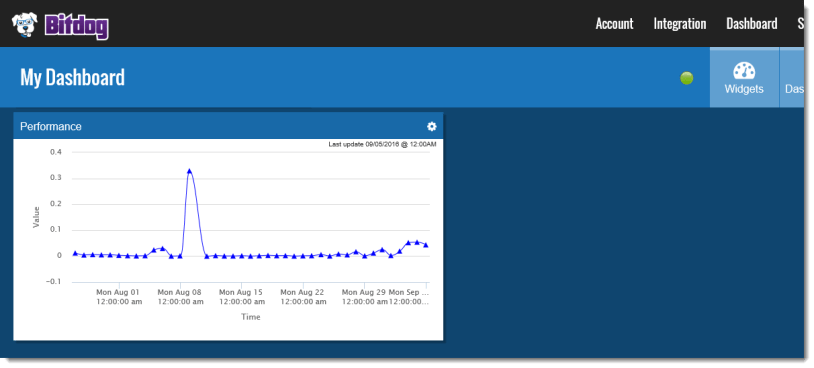
Bitdog provides a simple dashboard that can be used to create graphs and charts using data captured by Bitdog Hub. All data captured by Bitdog Hub is sent to the Bitdog Cloud in the form of JSON messages. The JSON messages are examined, augmented, captured in the Bitdog Data Lake, and then routed to their final destinations. These captured messages can be queried and computed in near real-time and used to create graphs and charts.
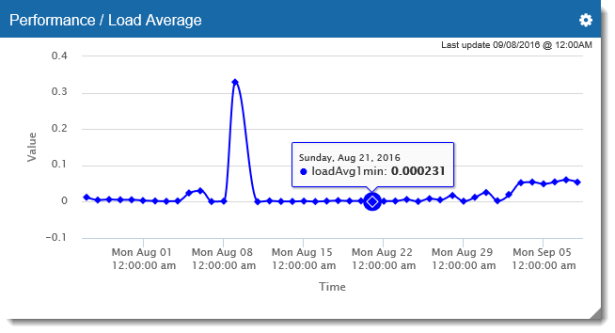
At the time of this post, Bitdog Dashboards support 7 widget variants.
Output widgets display data only where as input widgets can accept user input and send message back to Bitdog Hub. Dashboards can contain a mix of output and input widgets to create a simple user interface that can control and monitor the operations of one or more Bitdog Hub instances running on one or more pieces of hardware.
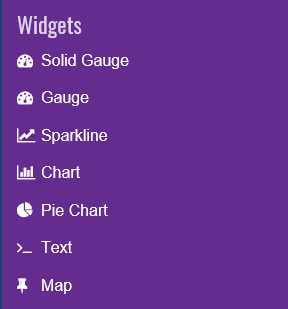
Realtime Chart
Realtime charts are able to pull historical data from the data lake while also updating in real-time when new data arrives in the cloud. Realtime charts can plot multiple series of data side by side for comparison.
Solid Gauge
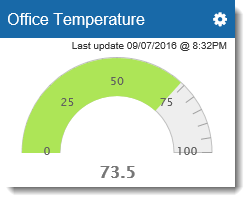
Solid gauges are able to pull the latest historical data point from the data lake while also updating in real-time when new data arrives in the cloud. Solid gauges can only plot the latest data point for a single series.
Gauge

Gauges have the same functionality as solid gauges but with a different style. In future updates, style differences maybe just be an option on a single gauge widget.
Sparkline

Sparklines are like realtime charts except with a much simpler and compact interface design. The main difference is that a sparkline can only show one data series.
Text Output

Text output widget displays the value of a JSON message property as text. It can have additional text display in front and behind the value. In future updates this widget will use more robust string formatting syntax.
Map
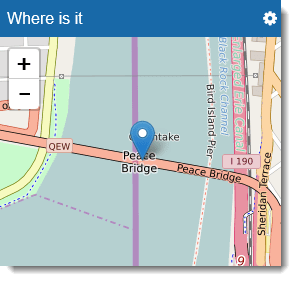
Map widget will pin point two values from a single JSON message. One value must represent latitude and the other longitude. The map updates automatically as messages provide new data.
